In general, when we observe samples under an optical microscope, the magnification of the image is the product of the magnifying power of the eyepiece and the objective lens. As shown in Fig. 1, the magnification of the image is 40X, which is the product of the magnifying power of the eyepiece (10X) and that of the objective lens (4X).
Things get complicated when it involves micrograph-recording; the recorded images were magnified or shrank during the reproduction process such as drawing, printing, photographic processing or even showing on a screen, no matter it is recorded by hand-drawing nor via camera. The calculated magnification becomes “scientifically meaningless” if one is not informed of the changes in magnification during the above process! None of the sample’s actual parameters (length, volume, density, etc.) could be computed from that reproduced image.
Some microscopic slides called “Stage micrometer” (Fig. 3) or “Calibration standard” are specially designed for such calibration, in order to measure and display the size of microscopic samples. When they are used coupled with graduated eyepiece (ocular micrometer), scales under different magnification can be easily obtained. These specially designed slides contain tiny ruler or spot with known dimensions.
The red divisions belongs to the stage micrometer, each division equals to 0.01mm;
the black divisions belongs to the graduation markings in eyepiece, and let’s calculate how long does each black division equals to:
From the Fig. 4, under 400X magnification, 10 red divisions equal to 23 black divisions, each black division equals to 0.00435mm.
Since we usually use the graduation markings in eyepiece for observation with naked eyes, we could use another method for computing the actual size of our target during camera recording. On the first hand, we take photo of the stage micrometer as the scale bar, then the target using the same magnification and camera settings, and we overlap and combine these two photos. After that, we could simply calculate the actual length of the target as follow:
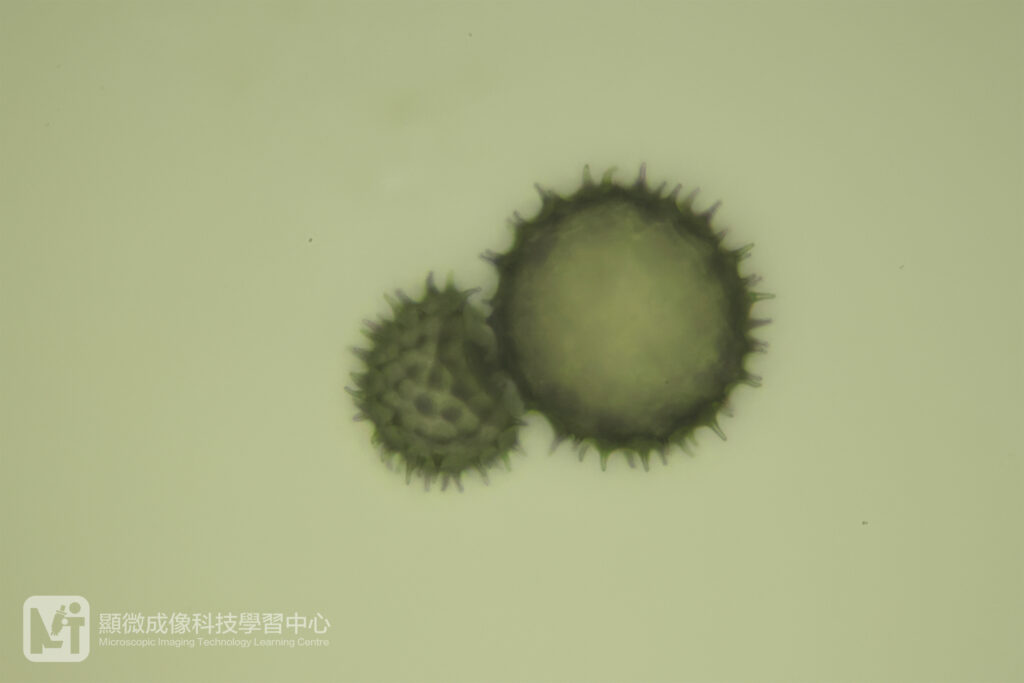
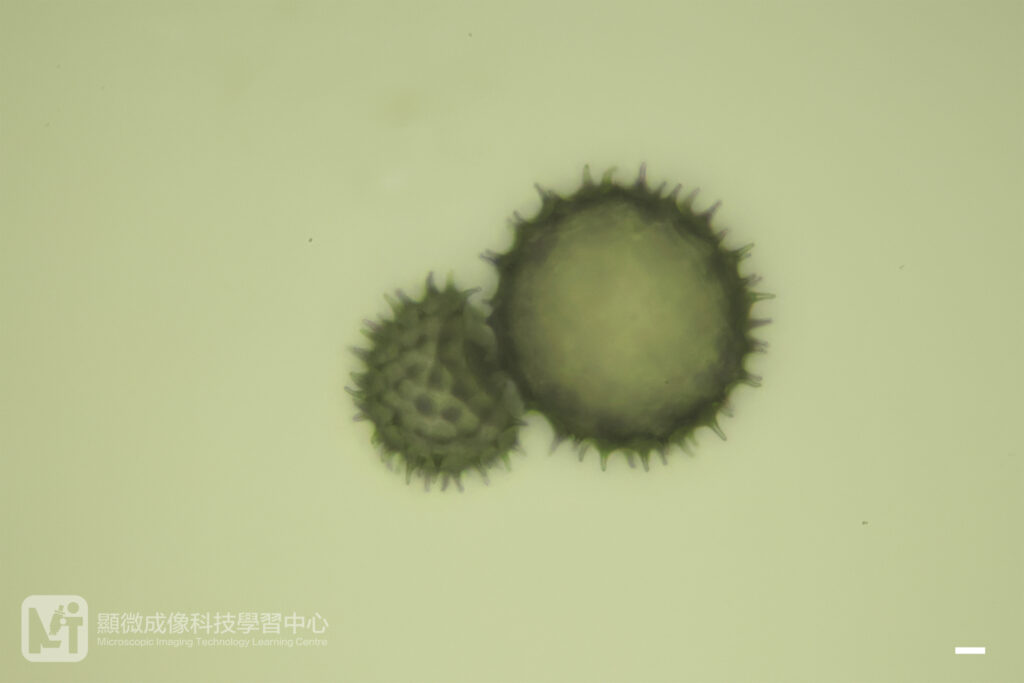
Under the same principle, whatever format or size the microscopic image or drawing is displayed, once a proper scale bar is found, calculation of the actual size of a microscopic sample would be a piece of cake. Now. it’s your showtime, please calculate the actual diameter of pollen grain in Fig. 7.